AI Dataset Analyzer
Overview
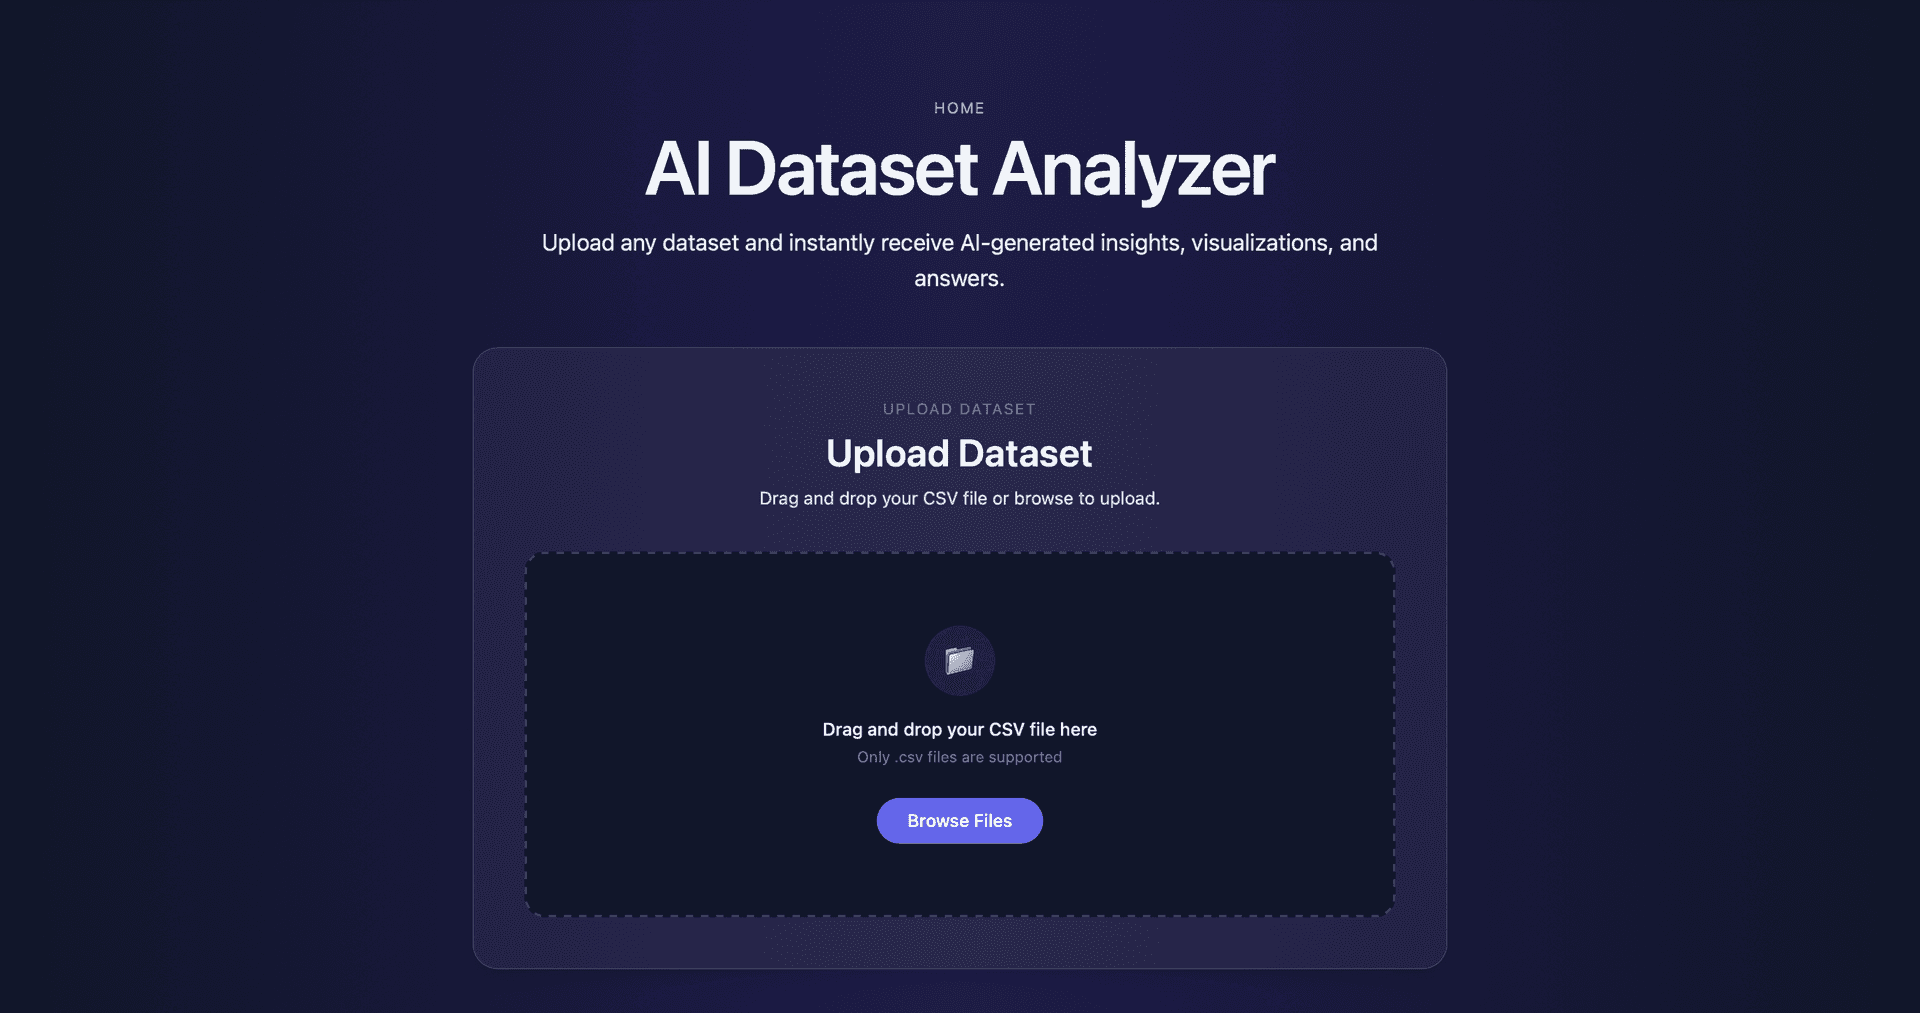
The AI Dataset Analyzer is a web-based tool designed to automate Exploratory Data Analysis (EDA) for uploaded datasets. The application accepts CSV datasets and automatically produces statistical summaries, visualizations, and human-readable insights that help users quickly understand the structure and patterns within their data.
The goal of this project was to reduce the amount of manual work required during the initial data exploration phase. Instead of writing custom scripts to inspect datasets, users can upload a file and immediately receive a structured analysis including descriptive statistics, data quality checks, visualizations, and AI-assisted insights.
This project was developed as part of a Data Mining course assignment focused on building a system capable of analyzing arbitrary datasets and generating meaningful EDA outputs automatically.
Problem
Exploratory Data Analysis is a fundamental step in the data science workflow, but it often involves repetitive tasks such as checking column types, calculating descriptive statistics, identifying missing values, and generating visualizations.
For unfamiliar datasets, analysts typically spend significant time writing small scripts just to inspect the structure of the data before meaningful analysis can begin. This process becomes even more time-consuming when working with multiple datasets or when sharing data exploration results with others.
The goal of this project was to design a system that could automate the most common EDA tasks while still producing clear and interpretable outputs. The system needed to be flexible enough to work with many types of datasets while generating insights that are grounded in actual computed statistics rather than generic AI-generated commentary.
Approach
The system follows a structured pipeline that mirrors the steps typically performed during manual exploratory data analysis. Once a dataset is uploaded, the backend analyzes its structure and identifies column types such as numeric, categorical, and text fields.
Statistical summaries are computed for relevant columns, including measures such as minimum, maximum, mean, median, standard deviation, and interquartile range for numeric features. Categorical columns are summarized using frequency counts and percentages to highlight dominant categories or unusual distributions.
Visualizations are then generated to illustrate distributions, relationships, and correlations between variables. These plots help reveal patterns such as skewed distributions, outliers, and potential relationships between features.
Finally, the computed statistics and structural information are passed to a language model to generate concise natural-language insights summarizing key findings from the dataset.
System Architecture
The application is built using a client-server architecture that separates the user interface from the data analysis pipeline.
The frontend is implemented using React and Tailwind CSS, providing a responsive interface where users can upload datasets and view analysis results. The interface is designed to present statistical summaries, plots, and AI-generated insights in a clean and structured layout.
The backend is implemented using FastAPI and handles the core data processing tasks. After receiving a dataset from the frontend, the backend performs data validation, computes statistical summaries, generates visualizations, and prepares structured data for insight generation.
For generating human-readable summaries, the backend communicates with the Gemini 2.5 Flash model using its free-tier API. The model receives structured statistics and metadata about the dataset, which helps ensure the generated insights are grounded in real computed values rather than invented observations.
Dataset Analysis Pipeline
The dataset analysis pipeline was designed to operate on arbitrary CSV datasets while producing consistent outputs.
When a file is uploaded, the backend performs the following sequence of steps:
- Dataset overview generation: The system first inspects the dataset to determine the number of rows and columns, column names, and inferred data types.
- Data quality checks: Basic quality checks are performed, including detection of missing values, duplicate rows, columns containing only a single value, and columns with a high percentage of missing entries.
- Descriptive statistics: Numeric columns are summarized using measures such as mean, median, standard deviation, and interquartile range. Categorical columns are summarized using frequency distributions and percentages.
- Visualization generation: Several visualizations are generated to illustrate the structure of the dataset. These include histograms, boxplots, scatterplots, and correlation heatmaps.
- Insight generation: The computed statistics and dataset metadata are passed to a language model to generate concise bullet-point insights summarizing key trends, patterns, and anomalies.
Key Features
The system includes several features designed to automate the exploratory data analysis workflow.
- Automatic dataset inspection identifies column types, dataset dimensions, and structural characteristics without requiring manual configuration.
- Descriptive statistics provide summaries of both numeric and categorical columns, allowing users to quickly understand distributions and central tendencies.
- Visualization generation produces a variety of plots that highlight patterns within the dataset, including distributions, relationships between variables, and correlations.
- AI-assisted insight generation transforms computed statistics into human-readable explanations that summarize important patterns and anomalies within the dataset.
- The system also detects potential limitations in the dataset such as missing values, imbalanced categories, and possible sampling biases.
Technical Stack
The backend of the application is implemented using Python and FastAPI, which provides a lightweight framework for building high-performance APIs. Data analysis tasks are performed using standard Python data processing libraries, while visualizations are generated programmatically and returned to the frontend for display.
AI-generated insights are produced using the Gemini 2.5 Flash model through its free-tier API. Instead of allowing the model to analyze raw data directly, the backend first computes statistical summaries and passes those values to the model. This approach reduces the likelihood of hallucinated insights and ensures that generated observations are based on actual dataset statistics.
The frontend is built using React and styled using Tailwind CSS. The interface components and layout were developed with assistance from Codex, which was used to accelerate frontend implementation and UI refinement.
Deployment
The application is deployed using a distributed architecture that separates the frontend interface from the backend analysis service.
The React frontend is hosted on Vercel, which provides fast static hosting and automatic deployment from the project's GitHub repository.
The FastAPI backend is deployed on Render, which runs the data processing and insight generation pipeline. Environment variables are used to configure communication between the frontend and backend APIs.
Because the backend runs on Render's free tier, the service may temporarily spin down during periods of inactivity. The frontend includes retry logic and a countdown indicator to handle these cold-start delays and provide feedback while the server becomes available again.
Challenges & Solutions
Several technical challenges were encountered during development.
One challenge involved handling backend cold-start delays caused by free-tier hosting on Render. When the backend server spins down due to inactivity, the first request can take several seconds while the service restarts. To improve the user experience, the frontend includes a retry mechanism and countdown timer that waits for the backend to become available before declaring an error.
Another challenge involved API rate limits during AI insight generation. Because the Gemini API free tier enforces request limits, the system detects when the limit is reached and displays clear feedback to the user rather than showing a generic failure message.
Additional deployment issues related to dependency compatibility during frontend builds were resolved by adjusting package dependencies and ensuring consistent build environments between local development and deployment.
Future Improvements
Several improvements could extend the system further.
Future versions of the tool could support additional dataset formats such as Excel or JSON files, allowing users to analyze a wider range of data sources.
The system could also generate downloadable analysis reports in formats such as PDF or HTML, enabling users to easily share insights and visualizations.
Additional improvements could include more advanced anomaly detection techniques, interactive visualizations that allow filtering and exploration, and support for larger datasets through streaming or chunk-based processing.
These improvements would make the system more robust and capable of handling real-world data analysis workflows.